The good part is the SQL Monitoring is also available with Oracle Enterprise Manager. Below is the Snapshot from the Enterprise manager 12c

It can also be manually Extracted using the following script.
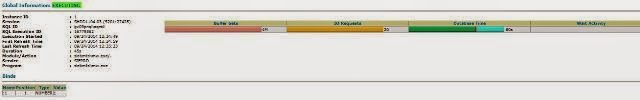
In the below example I am going to extract a SQL monitoring report for a very complex SQL. The SQL monitoring report extracted in HTML format clearly identify the steps where the most of the time id spent on
SET LONG 1000000SET LONGCHUNKSIZE 1000000SET LINESIZE 1000SET PAGESIZE 0SET TRIM ONSET TRIMSPOOL ONSET ECHO OFFSET FEEDBACK OFF
SPOOL report_sql_monitor.htmSELECT DBMS_SQLTUNE.report_sql_monitor(sql_id => '2fj0jatxnstyu', -- pass the SQL id as the argumenttype => 'HTML',report_level => 'ALL') AS reportFROM dual;SPOOL OFF
The step # 32 shows 96% of the CPU time is spent on it.

No comments:
Post a Comment