Tuesday 30 September 2014

enq: TX – allocate ITL entry

This is one of favorite Blog post i have submitted in my old blog "jehanzebahsan.wordpress.com" . quoting the same Text Here
----------------------------------------------------------------------------------------------------------------------------------------------
A few days ago i wrote an email regarding “enq: TX – allocate ITL entry” seen on one of our production databases to my development team. i just pasted that here in the post

Issue:

The issue we have faced on a DB  was extensive locking on the TBL_jehanzeb (an arbitrary name used here) table. The specific wait events we have observed on the database were “enq: TX – allocate ITL entry”
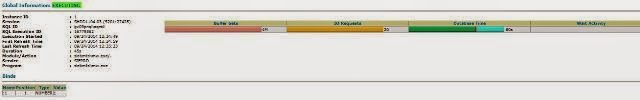
Our EM grid control was showing some horrific hills; and we were especially concerned about the brown ones ( the configuration waits).. As a DBA i have destroyed my aesthetics ; because i cant admire such a beautiful blend of colors on the EM GRID control .

Analysis:

On the particular day the traffic on the database was very high raising the Transactions per seconds to 90k ( which on average is 40-50k )
The Particular wait event we faced on this table explains the situation as following.
This is the snapshot of an Oracle Block. With the value of PCTFREE=10 in the TBL_jehanzeb table

The oracle block Header the top part shown in the figure contains the ITL ( interested transaction list) i-e a linked link where each node represents the a single interested transaction. As the number of interested transaction (especially updates) grow the header starts expanding downwards and the row data starts expanding upwards until there’s a situation shown in the figure below
There is no more room in the block for a new ITL entry. A new transaction comes in to update Record3. The transaction will have to wait. This is not the same wait as a row lock; because there is no lock on the row marked Record3.Instead, session will wait on a special wait event known as the “enq: TX – allocate ITL entry”.  The moment one of the transactions – from either Session1 or Session2 end by commit or rollback, the new transaction can grab that ITL slot and complete the locking operation. Until then the session3 will acquire a block level exclusive lock.
The  V$SEGMENT_STATSTICS shows the significantly high ITL waits on the table TBL_jehanzeb as compared to the closest competitors . (Rest of the table names omitted using the renowned MS paint again for the INFO. SECUrity reasons)
Solution:

  • Change the application design to avoid this bone of contention by reducing the number of hits on the table TBL_jehanzeb
  • Increase the PCTFREE and INITTRANS parameter as the database level for this particular table.
    • alter table <name> pctfree 50;
    • alter table <name> initrans 100

Monday 29 September 2014

Sessions PGA memory utilization Scripts

Following are some of the very useful PGA memory utilization scripts.

Total PGA Memory utilization for all Sessions

SELECT sum(trunc((VALUE/1024/1024))) || ' MB' "TOTAL MEMORY FOR ALL SESSIONS"
    FROM V$SESSTAT, V$STATNAME
    WHERE NAME = 'session pga memory'
    AND V$SESSTAT.STATISTIC# = V$STATNAME.STATISTIC#;


PGA Memory for all sessions individually 

select s.program,p.pid,s.sid,spid,s.program,s.status,
round(PGA_USED_MEM/(1024*1024),2) as PGA_USED_MEM,
round(PGA_ALLOC_MEM/(1024*1024),2) as PGA_ALLOC_MEM,
round(PGA_FREEABLE_MEM/(1024*1024),2) as PGA_FREEABLE_MEM,
round(PGA_MAX_MEM/(1024*1024),2) AS PGA_MAX_MEM
from v$process p, v$session s where s.paddr = p.addr(+)
and s.sid not in (select sid from v$mystat)
and s.machine in ('BSS\TPSIPAPP01','BSS\TPSIPAPP02')
order by p.pga_alloc_mem desc;

Friday 26 September 2014

Why The Data Files Got Extended Up Over The Weekend

The title i use for this post is exactly the same as the Oracle Support document "Doc ID 1538442.1".

One fine day i logged in to one of my Production databases for a routine health check and found the database Physical size has grown almost 500GB in just 2 days.  That was a biggg shock as the DB growth trend was never like that before. I knew he data itself cannot grow such to such a figure in just two days so why did the tablespaces autoextends with any check. 

the first that comes to my mind the recent changes in the database environment and there was only one; the oracle database 11g upgrade from 10g.

The document i mentioned in my title comes to the rescue. It expalined the behaviuor i have just explained. Quoting the exact words

"There are a new feature in 11g that can do this behavior, SMCO (Space Management Coordinator) background process

SMCO coordinates the following space management tasks. It performs proactive space allocation and space reclamation.
The main advantage is that sessions need not wait for reactive space allocation/deallocation operations as this is proactively done, and hence a gain in performance."

I think the Oracle 11g thinks the DBAs are not wise enough to handle space management tasks. So i decided i won't let Oracle database to take control in my authority :) ; and disable the feature.

"This feature can be disabled by the following step:
~~~~~~~~~~~~~~~~~~~~~~~~~~~~~~~~~~~~~
SQL> ALTER SYSTEM SET "_ENABLE_SPACE_PREALLOCATION" = 0;

The feature can be turned on again any time by setting "_enable_space_preallocation"=3 which is the default value:
SQL> ALTER SYSTEM SET "_ENABLE_SPACE_PREALLOCATION" = 3;

NOTE:
- The parameter is dynamic and the scope is ALTER SYSTEM.
- Please use the double quotes as indicated to prevent an ORA-911 because of the leading '_'
"

Thursday 25 September 2014

Exadata Storage Space Calculation

Exadata the Oracle engineered database machine has taken the OLTP database database performance to the next level. It has a number of power pack features flash cache, Smart scans and storage indexes that really provides the great returns on the investment.

How much usable storage a cutomer gets with every configurtion of the Exadata (quarter, Half or full Rack) is a little tricky for the customers guage.


Now below diagram shows the Exadata disk architecture for every disk. The physical is virtualized as a cell disk and then a grid disk to be presented to the Disk groups. (i'll keep the disk architecture discussion for some later post)


now for all the cells the structure would be something like


Lets take the example and oracle Exadata quarter rack example ang calculate what exactly the customer gets in terms of storage space.

The Quarter Rack Consists of

- 2 DB nodes
- 3 Storage Cells


Now the 3 Storage cells ( with high performance disks) has the following configuration


Step 1: Calculate the RAW Storage 

total Raw capacity => 12 disk on each cell * 600 GB each disk * 3 cells
                   => 21600GB or 21.09TB


now 30 GB on the first two disks of every cell is reserved for Linux OS. So by default to a disk group is created with 30 GB of disk space from remaining 10 disks from every cell.


so we have a Disk Group name DBFS => 10 disks from each cell * 30 GB from each disk *3 cells
                                                   DBFS => 900 GB

so We are left with 570GB on each disk i-e a total of "20520 GB" or  20.03TB 


Step 2: Now consider the mirroring requirement

 After NORMAL Redundancy (i-e double mirroring) Avialable RAW CAPACITY 20.03/2 =  10.01TB.

Step 3: Reserve free space for fault tolerance. 

with Disk failure coverage (DFC) one disk of 600GB is required to protect against the failure of one disks in a cell.

NOTE: that is a very important part. You need to plan for a Disk failure coverage or for complete cell node failure coverge. The ORACLE support document "Understanding ASM Capacity and Reservation of Free Space in Exadata (Doc ID 1551288.1)" clearly describes the different strategies and their pros and cos.

NOTE: After the application of BPS10 (11.2.0.4.10) the default is now the Disk Failure Coverage rather than the Cell Failure Coverage.


 This means that available is 10.01 TB - 0.57TB (i-e 600GB) =>  9.4 TB

Step 4: Decide the proportion of the Recovery Area. For example 60/40 (40% for recovery area)


 So the Recovery area size (RECODG) would be => 3.76 TB
and the DATADG would be => 5.64TB


Wednesday 24 September 2014

Oracle Real-Time SQL Monitoring

Oracle real-time SQL Monitoring is one of the very exciting features i have used recently. Its a very effective way to identify problems related to performance in long running queries especillay with the ones with complex execution Plans. It shows Stats at every step in the execution plan with key performance metrics including elapsed time, CPU time, number of reads and writes, I/O wait time and various other wait times. It allows us to have a deeper look inside the query plans and pin point the exact pain areas and then develop a startegy for SQL tuning.

The good part is the SQL Monitoring is also available with Oracle Enterprise Manager. Below is the Snapshot from the Enterprise manager 12c


It can also be manually Extracted using the following script.
In the below example I am going to extract a SQL monitoring report for a very complex SQL. The SQL monitoring report extracted in HTML format clearly identify the steps where the most of the time id spent on

SET LONG 1000000SET LONGCHUNKSIZE 1000000SET LINESIZE 1000SET PAGESIZE 0SET TRIM ONSET TRIMSPOOL ONSET ECHO OFFSET FEEDBACK OFF
SPOOL report_sql_monitor.htmSELECT DBMS_SQLTUNE.report_sql_monitor(sql_id => '2fj0jatxnstyu', -- pass the SQL id as the argumenttype => 'HTML',report_level => 'ALL') AS reportFROM dual;SPOOL OFF


The step # 32 shows 96% of the CPU time is spent on it.